Research on O-C diagrams
University of Athens Observatory participated in several observational monitoring campaigns on eclipsing binary systems and pulsating stars with the aim of determining the precise time of minimum and maximum light, respectively. These timings give the absolutely necessary information for the determination of orbital behavior of the members in a binary system, through the O-C diagrams (Observed - Calculated). Specialized observing programs aim to study the O-C diagrams and extract information about the Light-Time effect (LITE), basically due to the presence of a third body orbiting a binary system or a second body orbiting around a single star.
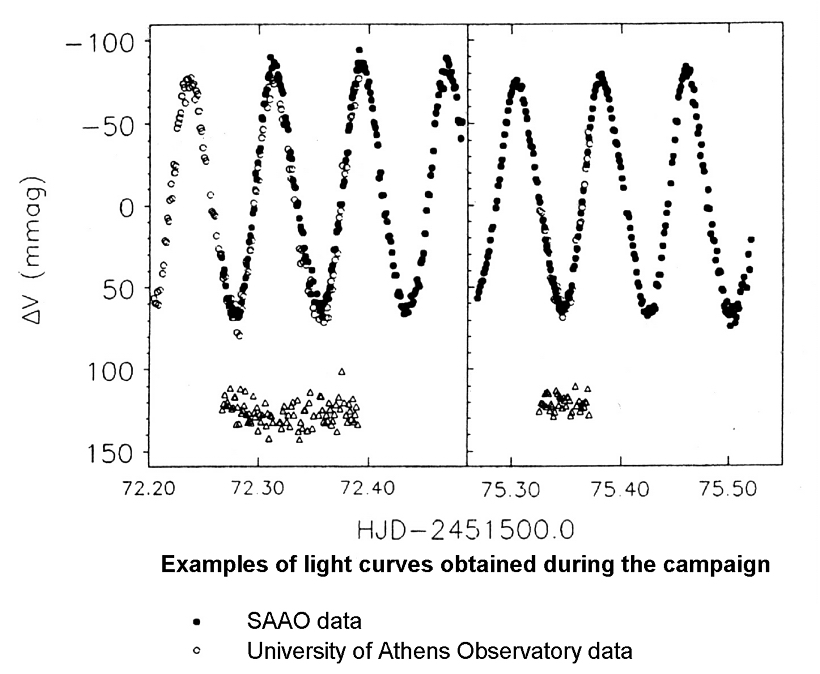
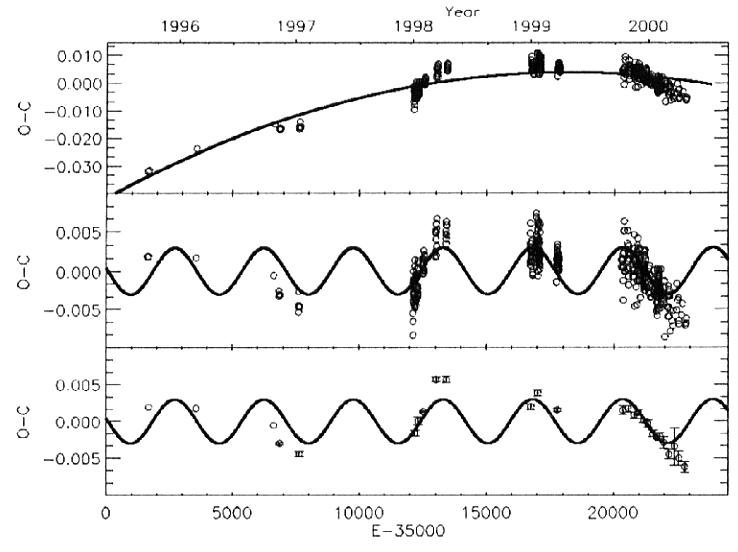
The long-term monitoring of the pulsating star V1162 Ori
The international campaign on the pulsating star V1162 Ori was initiated in 1999 by Chris Sterken, and its goal was follow-up observations on this High-amplitude delta Scuti Star (HADS), in order to recover its multiple periodicities. The target appeared to have many pulsation frequencies as expected, as well as a very interesting O-C diagram, which show the presence of an orbiting star around V1162 Ori.
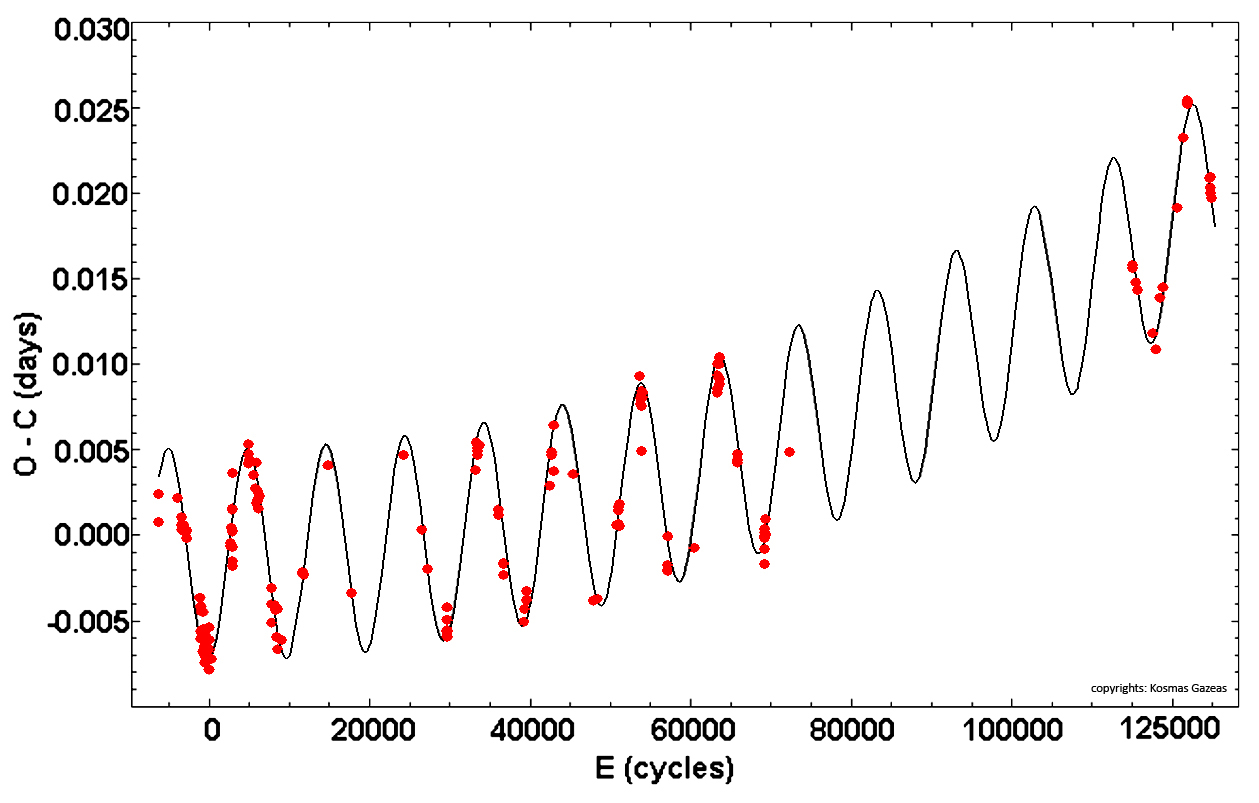
The binary nature of the pulsating star SZ Lyn
The pulsating star SZ Lyn is a perfect example of a HADS within a binary system. This target was observed for several years (2001-2015) and the O-C diagram has revealed the binary nature of this system (Gazeas et al., 2004, CoAst, Vol. 145, 49 and Gazeas et al., 2004, CoAst, Vol. 144, 26).
Disentangling the O-C behavior
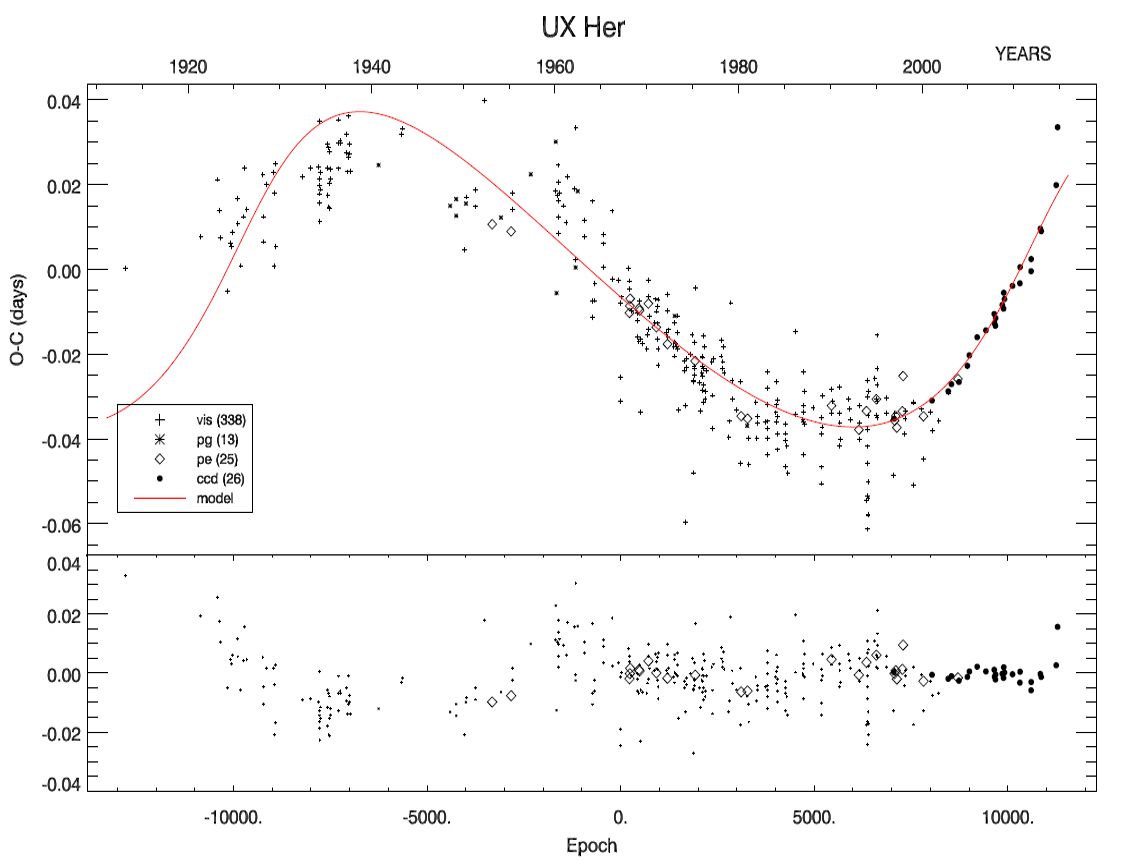
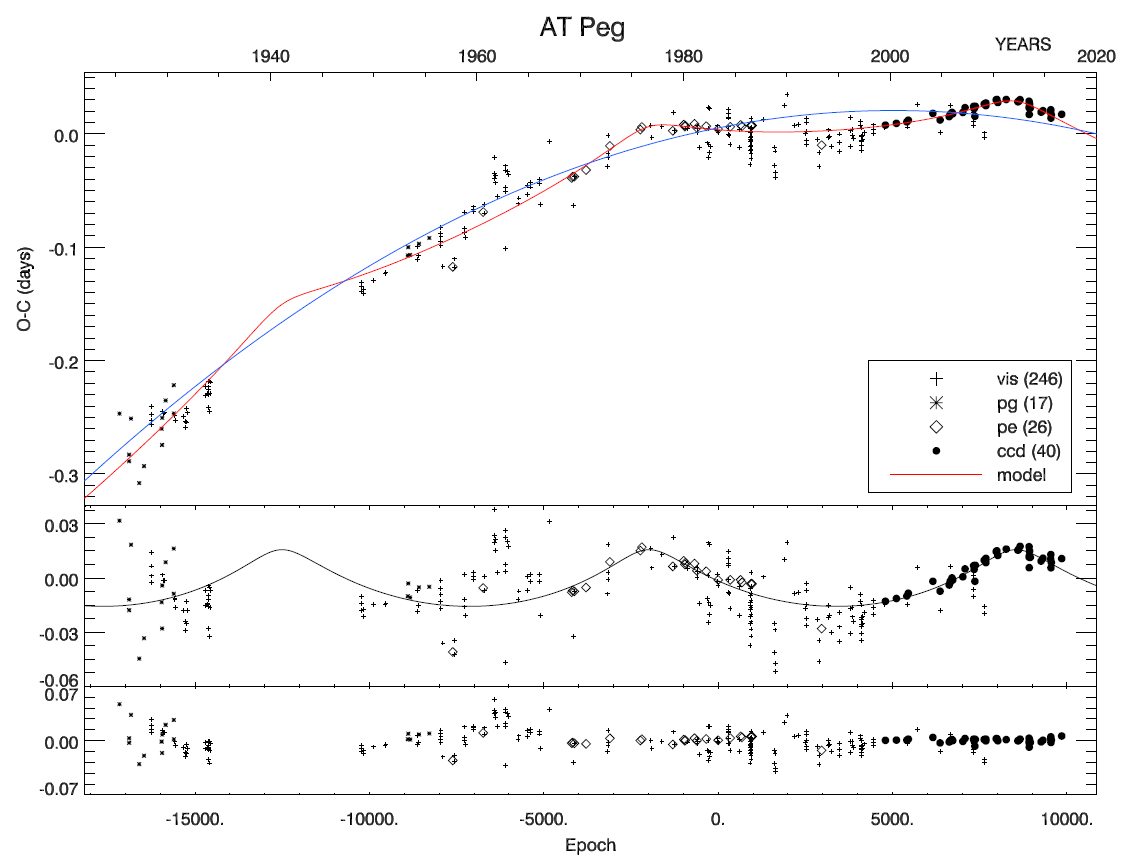
The way that various physical processes act in binary systems can be disentangled by interpreting their orbital period changes. Especially in the case of eclipsing binary systems, this may happen by analyzing their O-C diagrams, i.e. by monitoring their eclipse timing variations (ETV).
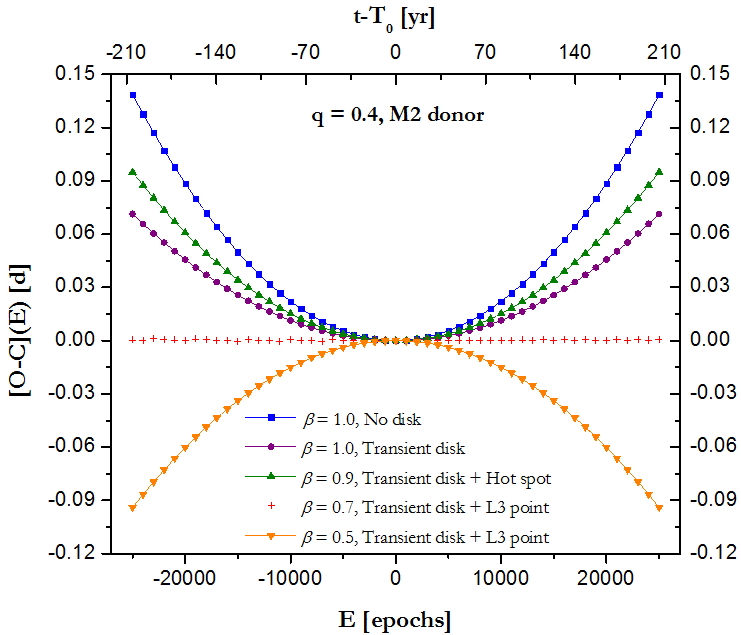
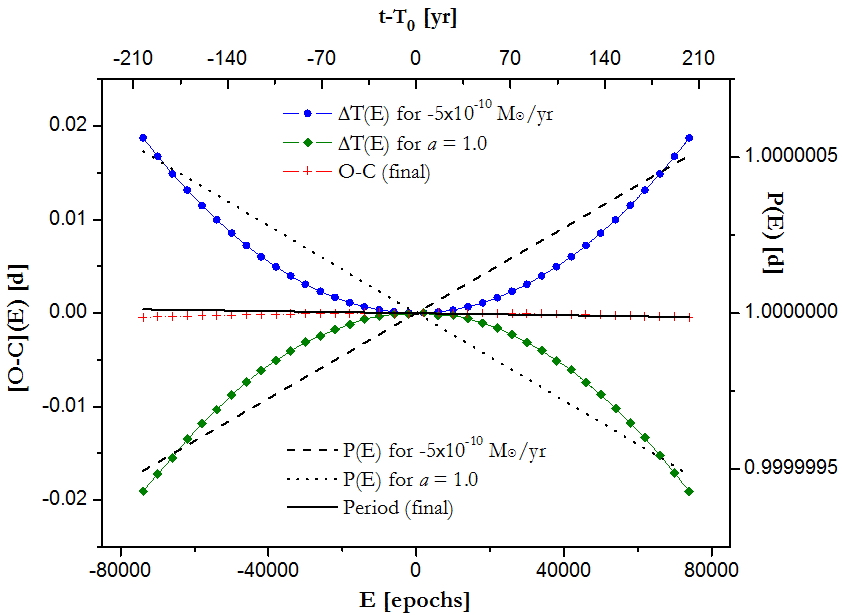
A dedicated study of O-C diagrams was conducted in 2011, in the frame of a PhD dissertation. It addresses the way these mechanisms -acting individually or combined- modulate the O-C differences and, consequently, fix the morphology of the O-C diagrams. It was achieved to specify the minimum time interval (i.e. number of orbital cycles) over which a pure O-C signal could be observable under the action of physical processes such as wind-driven mass loss, magnetic braking, non-conservative mass transfer of various types, and gravitational radiation at a given noise level.
To investigate how the noise level is affected by the photometric noise, the number of observations, the wavelength, the asymmetry degree of the minimum profile and even the method for the determination of its timing, a statistical study was properly designed. It was performed based on 114 CCD minima timings, most of them obtained at UOAO, and concerned two particular short-period eclipsing binaries, namely CG Cyg and RT And, because of their similar light and orbital parameters (same orbital period, equal minima depths). The analysis shown that high asymmetry and low observations quality increase considerably the O-C noise level when a mixture of methods such as the - most widely used - Kwee & van Woerden (1956, BAN, 12, 327) and the typical polynomial regression are employed along the whole O-C time-series length. An upper bound of 0.008 days was found from purely statistical reasons, that is without considering intrinsic stellar effects such as moving spots.
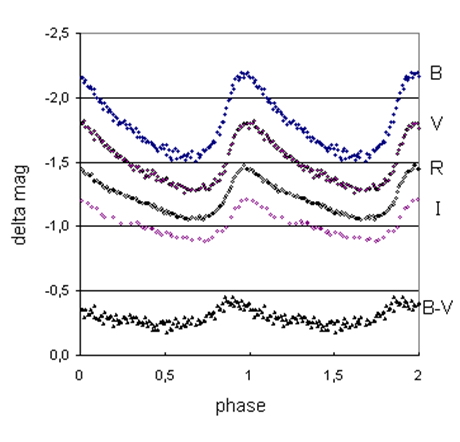
Beside the main goals of the above study, a long-term multiband monitoring of GSC 2696:2622 was carried out from UOAO. This target is a suspected variable star which served several times in the past as comparison star of CG Cyg. The star proved to be a low amplitude \delta Sct-type pulsator with a dominant frequency at 10.86 c/d and two less prominent peaks at 16.45 and 19.2 c/d. The first frequency was found consistent with a radial excitation mode, while the rest ones with non-radial oscillating modes. The two stronger peaks presented variations over time both in amplitude and phase, while the O-C diagram analysis based on all available maxima timings revealed considerable changes of the dominant frequency over the monitoring period, possibly attributed to the light-travel time effect of an unseen companion.
The University of Athens Observatory participated in several observations on O-C diagrams, which resulted in publications and scientific announcements in refereed journals.